
Energy-dispersive X-ray spectroscopy (EDS) is usually fitted to a scanning or a transmission electron microscope. An incident electron ejects an inner-shell electron from a sample atom; an outer electron then drops into the vacancy, and the energy difference between the two levels is emitted as a characteristic X-ray. A silicon drift detector (SDD) measures the energy of each photon and accumulates counts by energy, producing a spectrum with energy on the horizontal axis and counts on the vertical axis.
Peak positions identify the elements, while the net peak intensity, after subtraction of the continuous background, has to be compared with standards and corrected for the three matrix effects — atomic number, absorption and fluorescence — before it can be converted into a concentration. Within one shell, the line energy falls as the atomic number decreases, so the lighter the element, the closer its K line lies to the low-energy end of the spectrum.
“Light elements” in materials analysis usually means boron, carbon, nitrogen, oxygen, fluorine and the like — elements with atomic numbers from 5 to 9. They can only be analysed through their K lines, all of which lie below 1 keV: B Kα is at about 183.5 eV, and the Kα lines of C, N and O lie at about 0.28, 0.39 and 0.53 keV respectively.
The same energy range also carries the L lines of transition metals and the M lines of heavier elements, while the continuous background is shaped by absorption edges and by the detector response, making it most complex below 2 keV.
The Cr₂N precipitate in high-nitrogen stainless steel is one example: STEM-EDS clearly resolves the enrichment of Cr in the precipitate, yet the signal-to-noise ratio of the N map is only about 1.03, and the nitrogen-depleted zones on either side of the precipitate cannot be distinguished in the raw data.
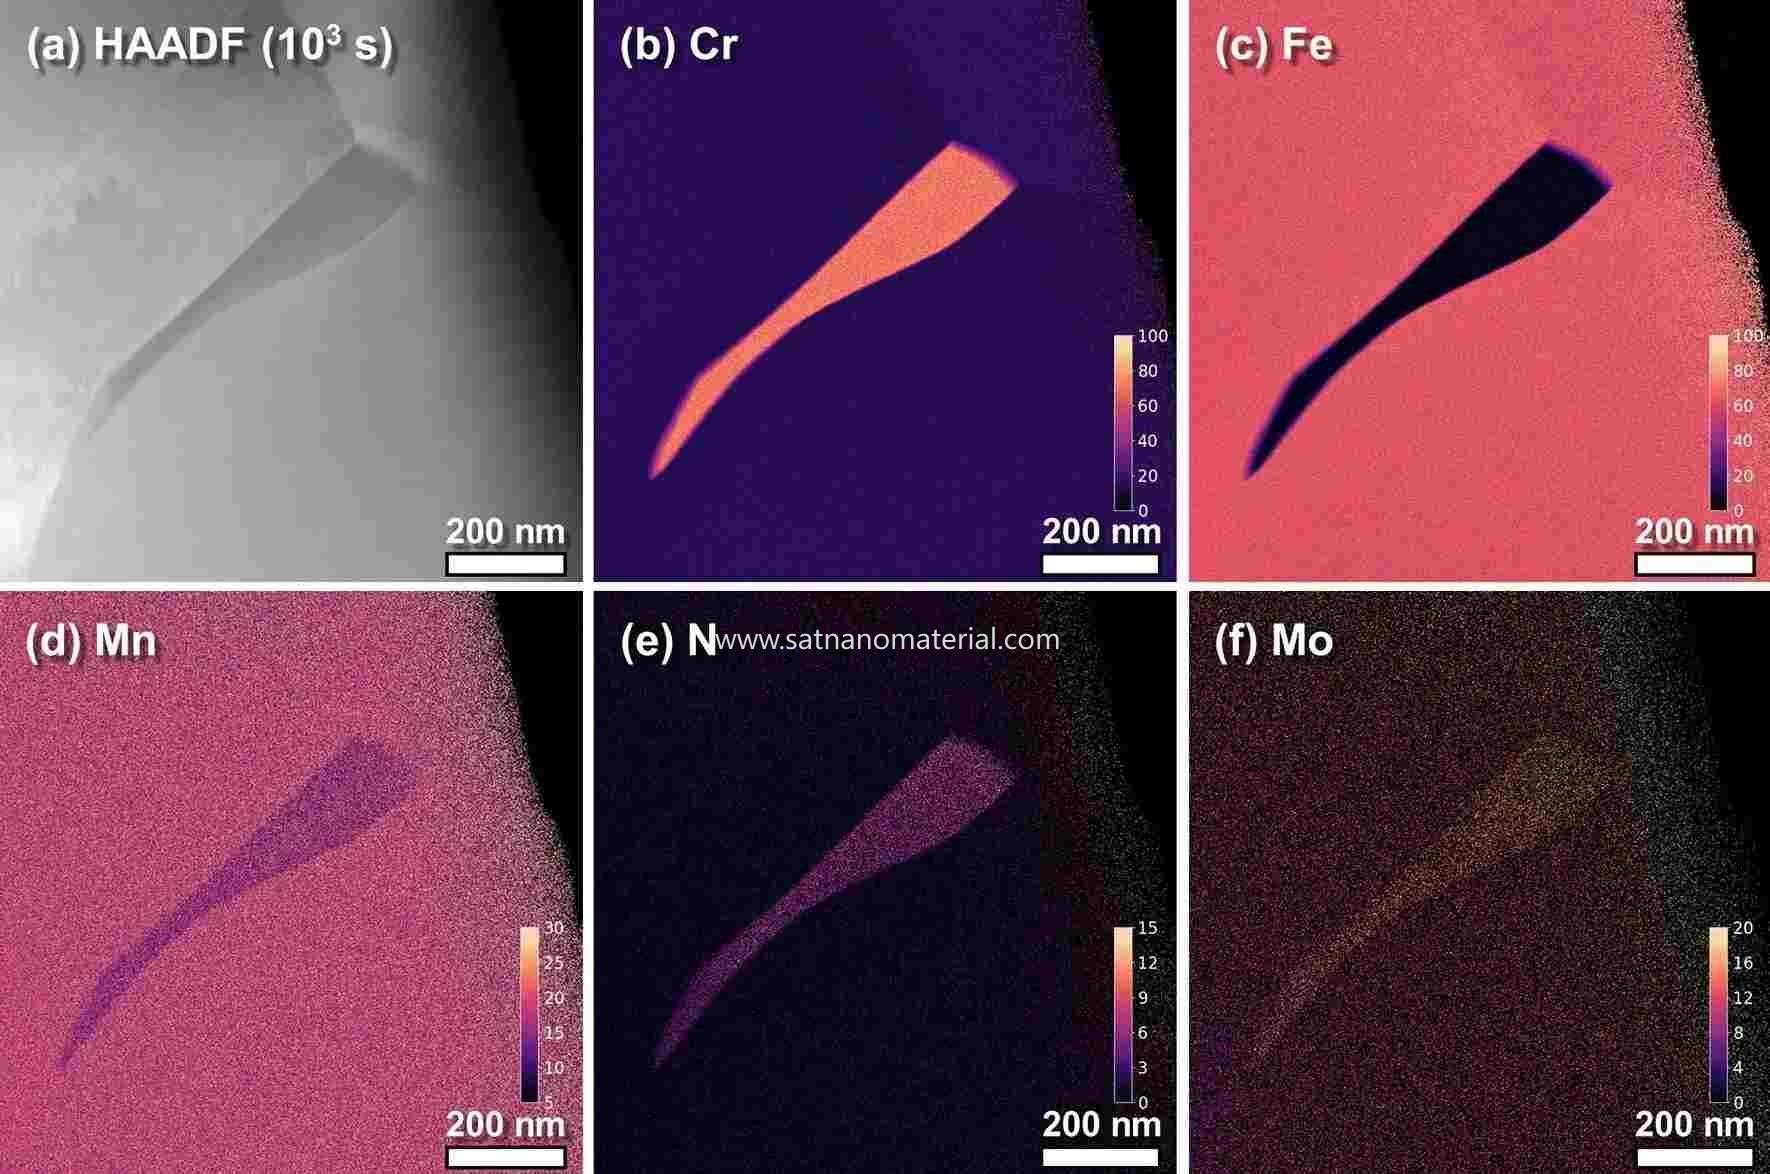
Figure 1.HAADF-STEM image of a Cr₂N precipitate in high-nitrogen stainless steel aged at 900 °C for 10³ s, together with EDS elemental maps of Cr, Fe, Mn, N and Mo. DOI: 10.1038/s41598-020-70674-y
One reason for the poor signal-to-noise ratio of N is that light-element atoms themselves emit few characteristic X-rays, and the lighter the element, the stronger this limitation. Hydrogen and helium emit no characteristic X-rays usable for analysis.
Lithium has only 1s and 2s electrons, and a 2s → 1s transition does not satisfy the dipole selection rule. When lithium is bonded ionically or covalently its outer electrons are transferred, so the K-shell vacancy has no electron able to fill it; only in metallic lithium or in bonding states with p-orbital character does weak Li Kα emission appear, at about 52 eV.
Windowless detectors designed for low-energy X-rays can detect the Li peak in metallic lithium and in some lithium compounds at an accelerating voltage of 3.5 keV, although peak identification must also rule out lines in the same energy range, such as Al Lα at 72 eV and Si Lα at 92 eV.
The scarcity of characteristic X-rays from light elements is bound up with the way an inner-shell vacancy relaxes. Once a vacancy exists, the atom can either emit a characteristic X-ray or hand the energy to another outer electron, which escapes as an Auger electron. The probability that the vacancy relaxes by emitting an X-ray is the fluorescence yield ωK, and the lower the atomic number, the more the Auger process dominates.
In the K-shell data compiled by Krause, ωK is about 0.0028 for C, 0.0083 for O, 0.050 for Si and 0.340 for Fe; for the same 1000 K-shell vacancies, carbon emits only about 3 characteristic X-ray photons whereas iron emits about 340.
With a low fluorescence yield, the light-element peaks collect fewer counts at the same beam current and acquisition time, and the statistical scatter is correspondingly larger. Raising the beam current or lengthening the acquisition time does accumulate counts, but the dose rises in step: the carbon contamination layer thickens and electron-beam damage worsens.
Even once produced, the photon still has to travel through the sample to reach the surface, and the mass absorption coefficient for low-energy X-rays far exceeds that for high-energy ones. The higher the acceleration voltage, the deeper the electrons penetrate, the longer the exit path of the X-rays, and the larger both the absorption correction and its uncertainty. Under conventional conditions at 10 keV and above, NIST found that quantification from spectral peaks below 1.5 keV was more biased than from high-energy peaks, and that the bias grew as the acceleration voltage increased.
Before reaching the detector a low-energy photon must also pass through the entrance window. Conventional windowed EDS systems work mainly above C Kα, and lower-energy X-rays are either undetectable or give a poor signal-to-noise ratio; a windowed detector generally needs nanoampere beam currents and acceleration voltages above 5 keV to accumulate enough counts.
An SDD is intrinsically more sensitive below 1 keV than the earlier Si(Li) detectors, and a windowless SDD removes the absorption of the window film and improves signal amplification in the low-energy region, so that X-rays below C Kα can be collected at beam currents of a few hundred picoamperes and acceleration voltages below 5 keV.
NIST measured Cr₂N at 10 keV, fitting the spectra with pure Cr and Si₃N₄ references by multiple linear least squares; the nitrogen atomic fraction came out at 0.350 against an ideal 0.333, a relative deviation of +5.1%, the largest among the nitrides measured, while the deviation for N in TiN was +2.0%.
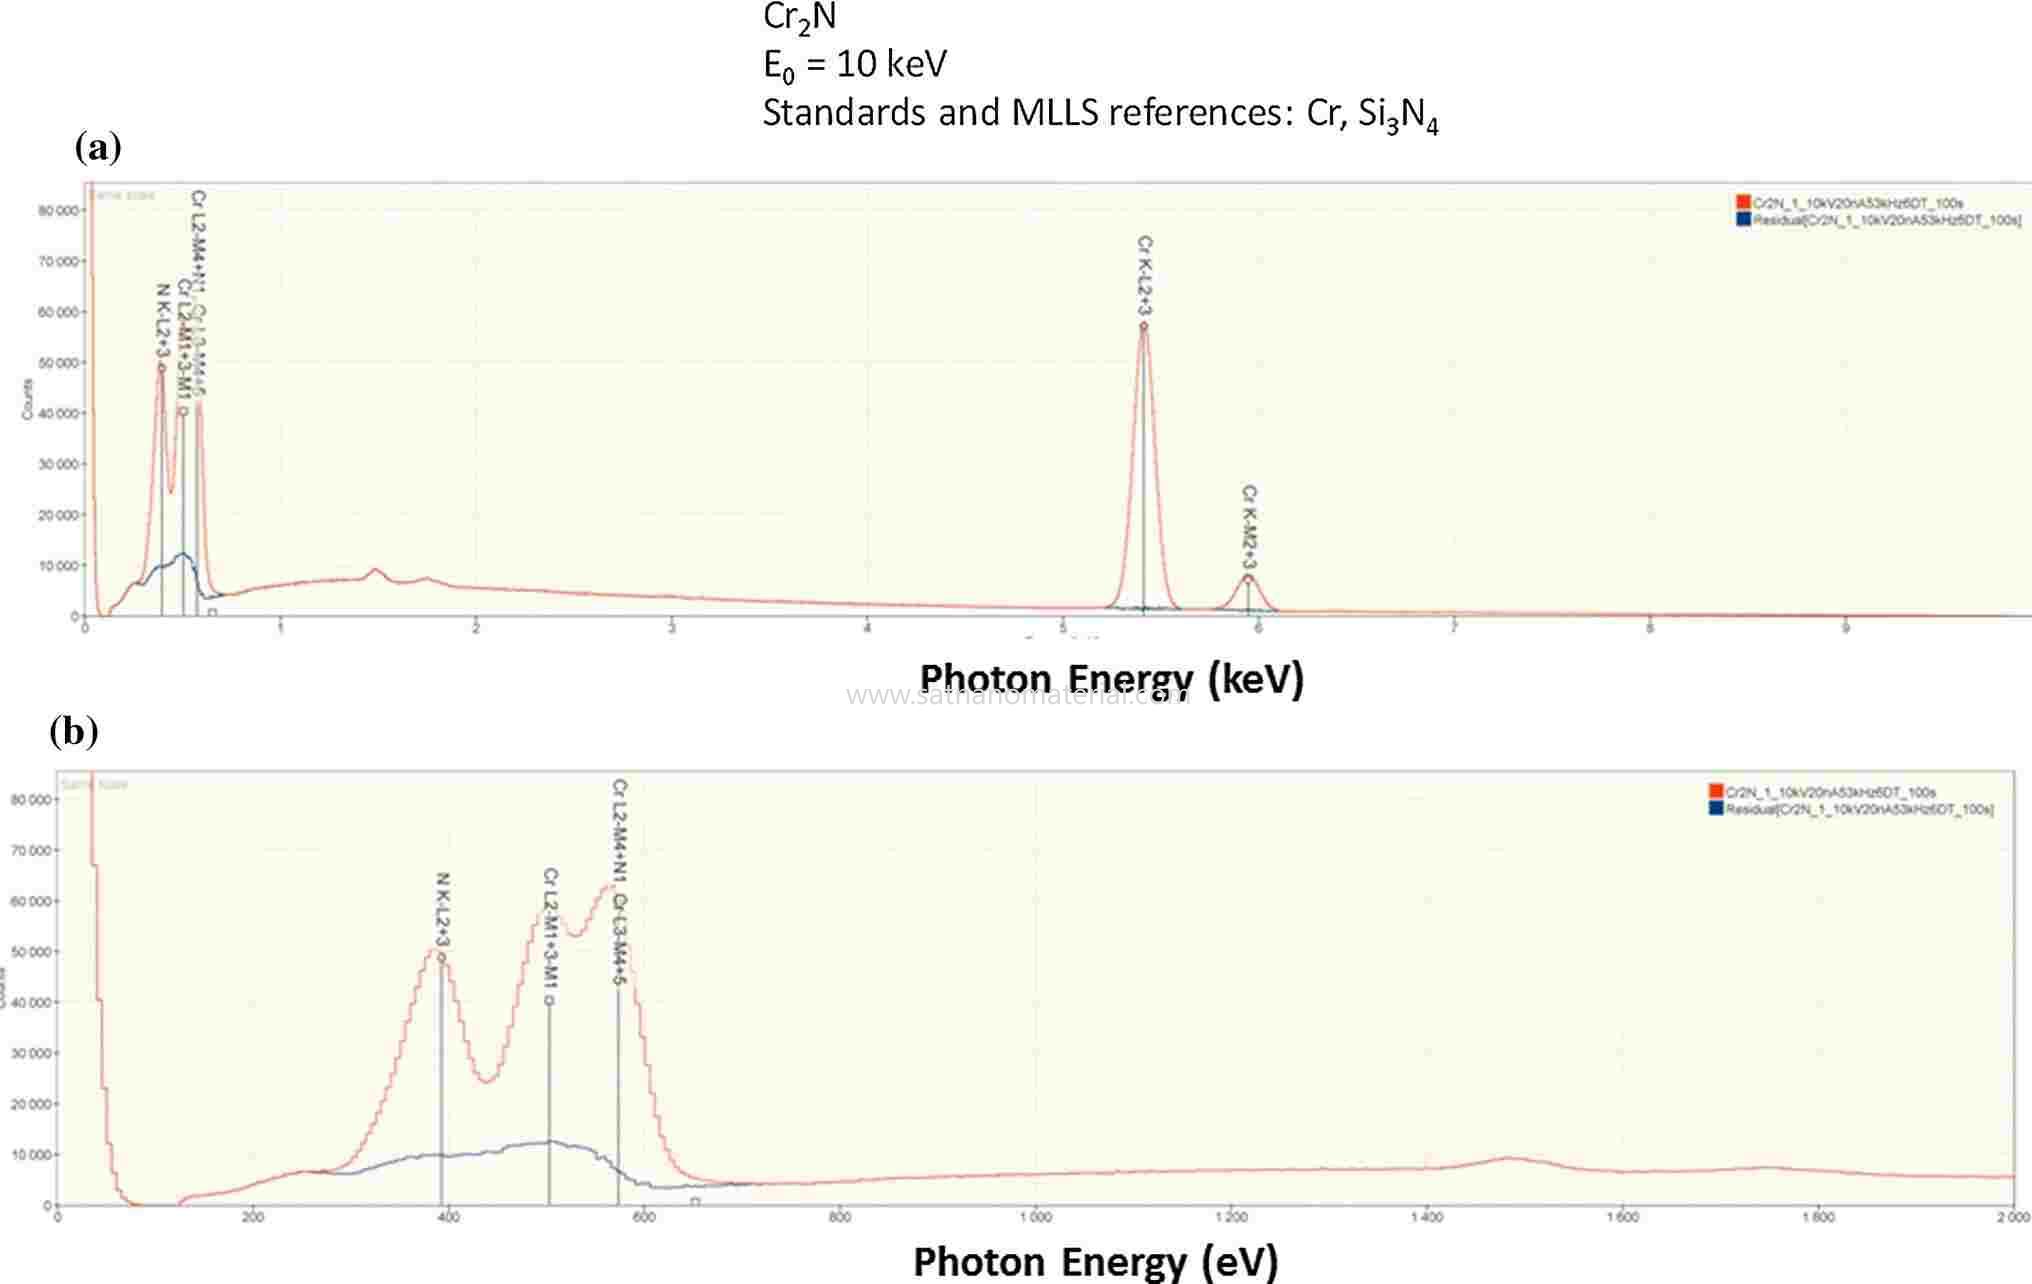
Figure 2.Full SDD-EDS spectrum of Cr₂N at 10 keV, the enlarged low-energy region, and the residual spectrum after multiple linear least-squares fitting. DOI: 10.1007/s10853-014-8685-2
Multiple linear least-squares fitting assumes that a given line has the same shape in the reference spectrum and in the unknown, and light elements often violate that premise: their K lines arise from valence electrons dropping into the 1s vacancy, so a change in chemical bonding alters the valence-electron states and shifts both peak position and peak shape.
High-resolution soft X-ray emission spectroscopy puts B Kα at 183.5 eV in elemental boron; in B₄C it moves to about 184 eV with reduced intensity on the low-energy side, FeB and Fe₂B develop a shoulder near 187 eV, and B₂O₃ shifts to 180.5 eV accompanied by two satellite peaks.
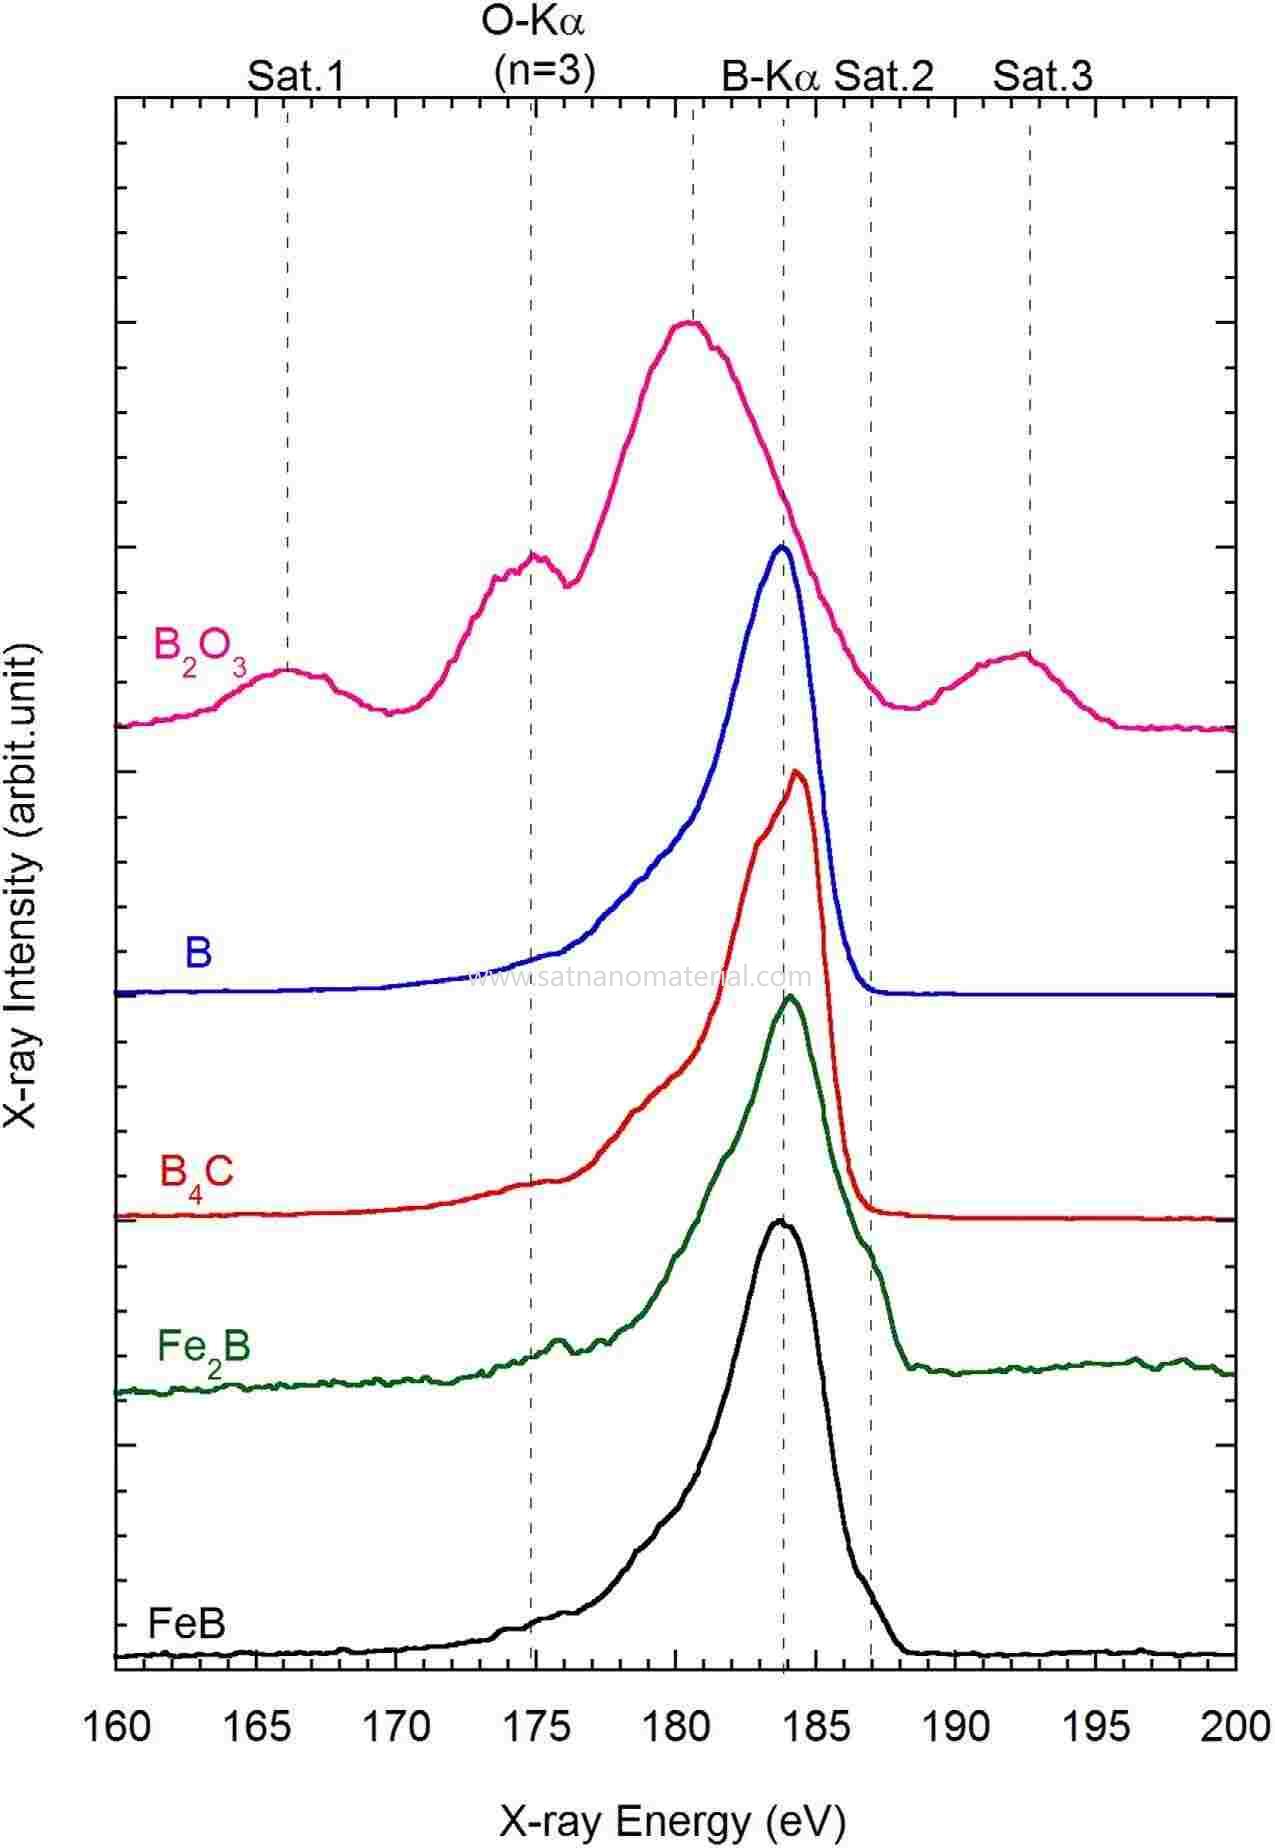
Figure 3.B-Kα spectra of B₂O₃, B, B₄C, Fe₂B and FeB measured by soft X-ray emission spectroscopy. DOI: 10.1038/srep25700
These shifts in boron amount to only a few eV, far below the tens of eV resolution of EDS, so an EDS spectrum shows a single broad peak — yet the difference in peak shape survives.
When the reference and the unknown differ in chemical state, that difference remains in the fitting residual and affects the extracted net peak intensity; in analysing fit residuals at 5 keV, NIST likewise listed the bonding-induced shift of the characteristic X-ray energy among the factors affecting the residual.
Beyond differences in peak shape, light-element peaks also pick up signal that does not belong to the bulk of the sample. The electron beam decomposes hydrocarbons on the sample surface and in the residual vacuum, depositing a carbon contamination layer in the irradiated area — the longer the beam dwells, the thicker the layer — and when a material is exposed to air an oxide or sulphide layer also forms on its surface. The lower the acceleration voltage, the shallower the excitation volume and the larger the share of the surface layer in the signal.
NIST measured AlN at 15, 10 and 5 keV and compared the three spectra on the basis of N Kα intensity; the relative intensities of C and O rose as the acceleration voltage fell, so this AlN sample was excluded from the accuracy statistics.
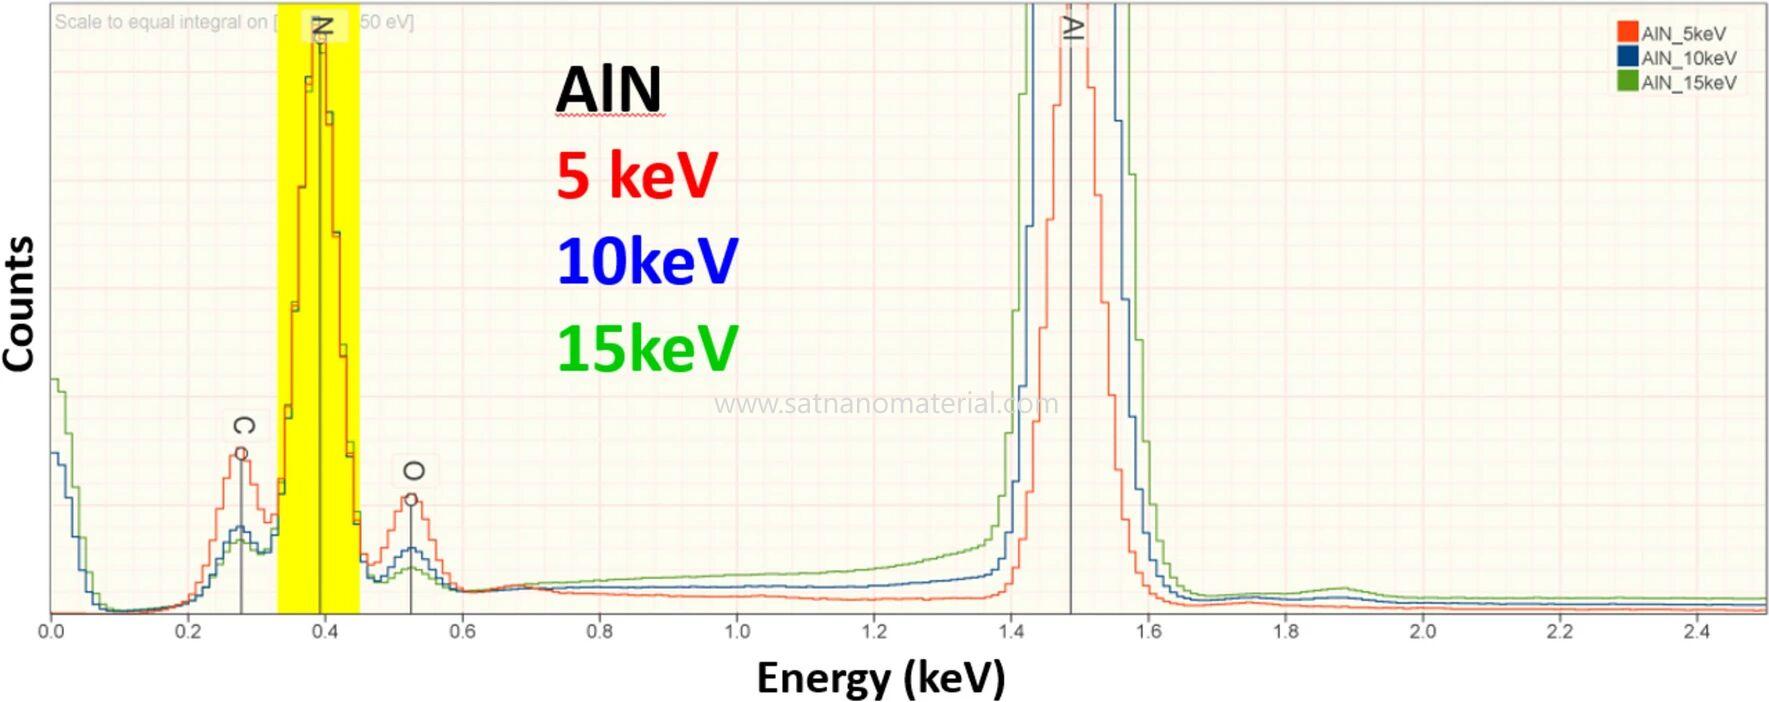
Figure 4.EDS spectra of AlN at 15, 10 and 5 keV, each normalized to the N K peak intensity. DOI: 10.1007/s10853-024-10285-4
Insulating samples are often coated with 8–10 nm of carbon to provide conductivity; this carbon layer contributes a C signal of its own and also absorbs low-energy photons. Above 10 keV the coating has a negligible effect on accuracy, but below 5 keV a difference in coating thickness between sample and standard introduces a significant error: the raw analytical totals NIST obtained at 5 keV were distributed between 0.8 and 1.2, which the authors attribute mainly to differences in coating.
A lithium content obtained by difference carries every quantification error of the other elements with it: one study of lithium battery cathodes took the missing mass fraction of the un-normalized quantification as the Li content, obtaining 6.0–6.4 wt% for uncoated samples — close to the 6.4 wt% expected for the fully lithiated state after the first formation cycle — whereas gold- or carbon-coated samples gave 10.6 and 10.4 wt%.
The effects of the coating, the surface layer and self-absorption all change with the acceleration voltage. The electron range is approximately proportional to E₀1.66, so at 5 keV the characteristic X-rays are generated at a shallower depth and the exit path of low-energy photons shortens; even though the photon energy is still low, the absorption correction is already markedly smaller.
At 5 keV, NIST quantified 263 standard measurements covering 39 elements in 113 materials: more than 98% of the results fell within ±5% relative deviation and 82% within ±2%, and the results obtained from 0–1.5 keV peaks were distributed similarly to those from 1.5–5 keV peaks.
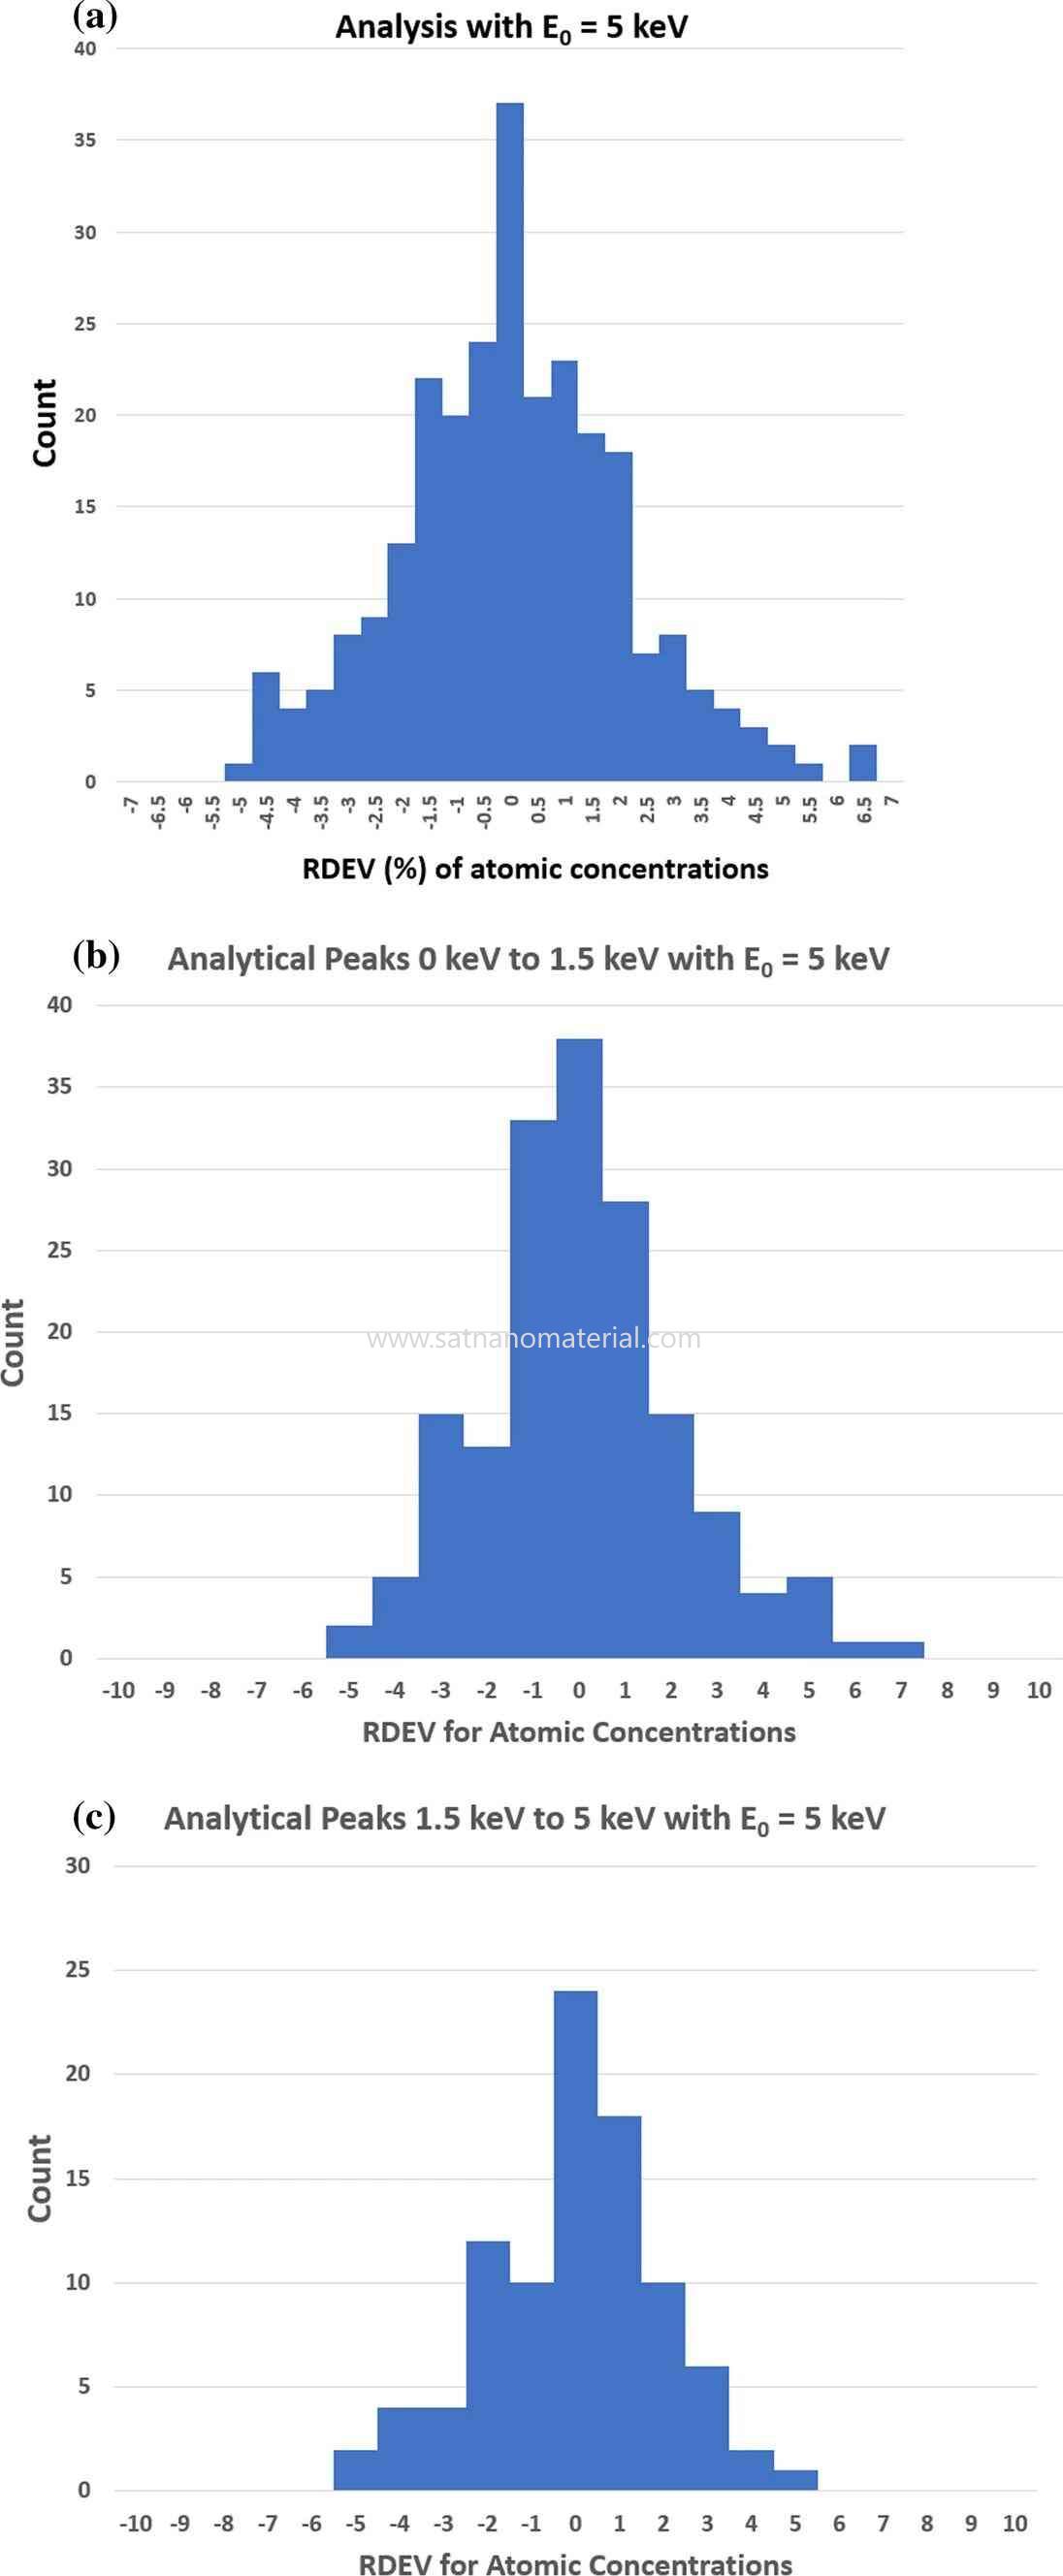
Figure 5.Distribution of relative deviations in atomic concentration from standard-based quantification at 5 keV: all results, 0–1.5 keV peaks and 1.5–5 keV peaks. DOI: 10.1007/s10853-024-10285-4
5 keV is also the lowest voltage at which usable characteristic X-rays can be excited for every element except H and He; elements such as Ti and Ba then have to be measured through their low-energy L- or M-series lines, which fall in the same energy range as the K lines of light elements.
Low voltages are more surface-sensitive, and the 5 keV statistics excluded samples with excessively thick surface layers. If the oxide or sulphide layer of a real sample accounts for a substantial fraction of the electron range, the excitation volume contains two materials at once, and the assumption of uniform composition on which k-ratio quantification rests no longer holds.
Stepping the voltage down from 10 keV and above to below 5 keV, and comparing the relative intensities of C, O and other light-element peaks across the spectra, can reveal a surface layer whose thickness approaches the electron range.
Besides the acceleration voltage, the standard sets the basis on which net peak intensity is converted into concentration. Standards-free quantification replaces measured standards with intensities from theoretical calculations or from a manufacturer's database; first-principles calculations require atomic parameters such as fluorescence yields and mass absorption coefficients, and many of these are of limited accuracy. One commercial standards-free package from 2013, as assessed by NIST, needed a relative deviation range of about ±30% to cover 95% of analytical results.
With pure elements or stoichiometric compounds as standards, and k-ratios measured at 10 keV, about 10% dead time and roughly 10⁷ counts per spectrum, the results for C, N, O and F narrow to about ±5%, enough to distinguish Cr₃C₂, Cr₇C₃ and Cr₂₃C₆, or SiO₂ from SiO and CuO from Cu₂O. In well-oxidized systems such as ceramics, glasses and minerals, the oxygen content is often calculated instead from the stoichiometry of the cation valence states.
Stoichiometric calculation requires the cation valence to be known; where the light-element distribution is needed on the nanometre scale, a signal that does not pass through X-ray emission can be used instead. Electron energy-loss spectroscopy (EELS) records the energy lost by transmitted electrons when they excite inner shells; it is not limited by fluorescence yield, and detection limits reach 0.005–0.1 at%.
On the Cr₂N precipitate in high-nitrogen stainless steel, EELS resolved the Cr- and N-depleted zones simultaneously; the two had the same width, about 70–100 nm, matching the denoised STEM-EDS result.
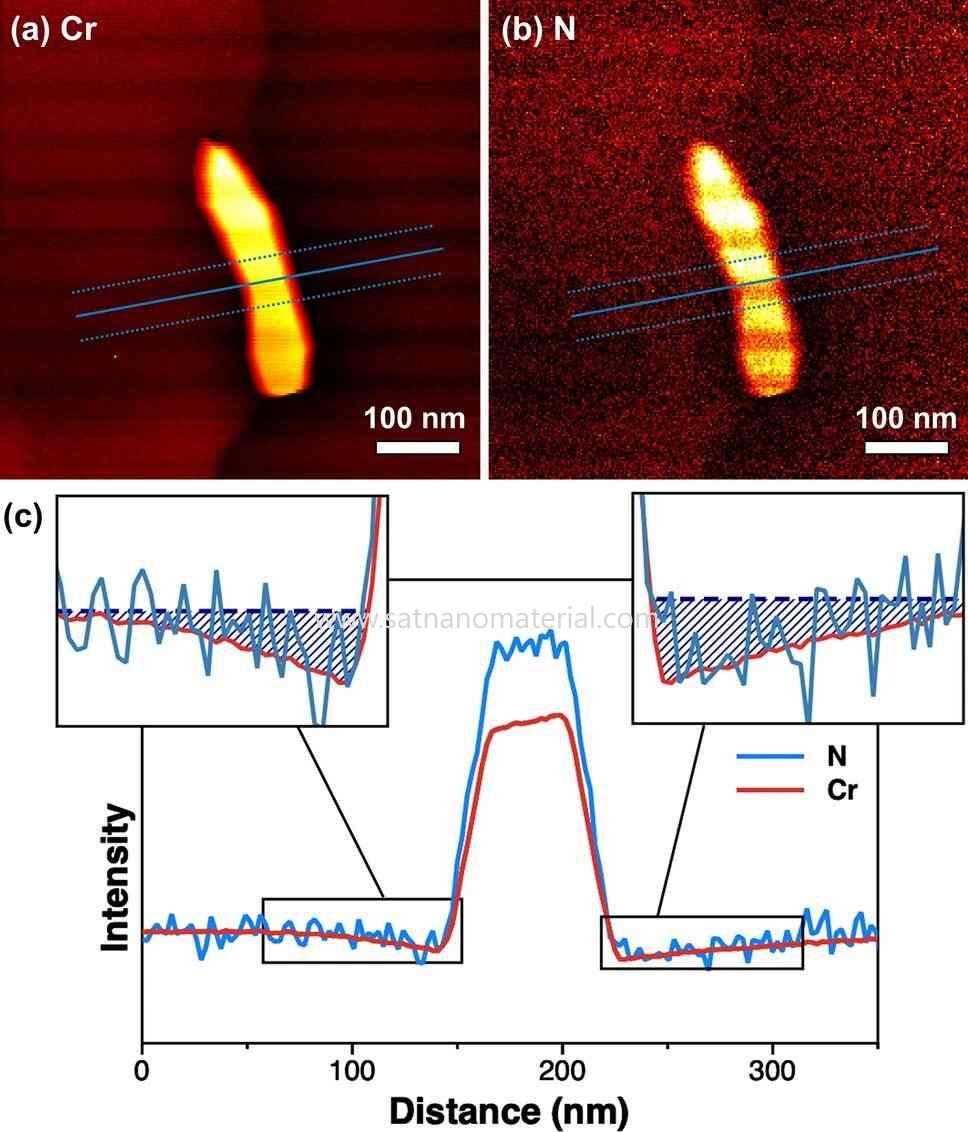
Figure 6.Cr and N EELS elemental maps of the Cr₂N precipitate and intensity profiles across the precipitate. DOI: 10.1038/s41598-020-70674-y
EELS requires the sample to be thin enough, the data processing has to subtract the multiple-scattering background — a step that can distort the spectral shape — and the measurement takes longer and costs more than EDS.
EELS yields an elemental distribution; distinguishing the chemical state of boron calls for a higher energy resolution than either conventional EDS or wavelength-dispersive spectroscopy can provide. A soft X-ray emission spectrometer fitted to an electron microprobe uses an aberration-corrected grating and parallel CCD acquisition to record soft X-ray spectra, and can use the B Kα peak shape to display residual B₄C particles and iron boride regions in control rods after oxidation testing as separate features.
SAT NANO speciaiszes in the developemnt production and application of nanomaterial. Its portfolio covers carbon material, metal powder, alloy powder, oxide powder and MXenes, MAX material, serving plastics modification, coating, energy, electronics, boimedical research, and new engergy applications. If you have any enquiry, please contact us at admin@satnano.com


 Servicio en línea
 13929258449
 admin@satnano.com
 + 8613929258449


